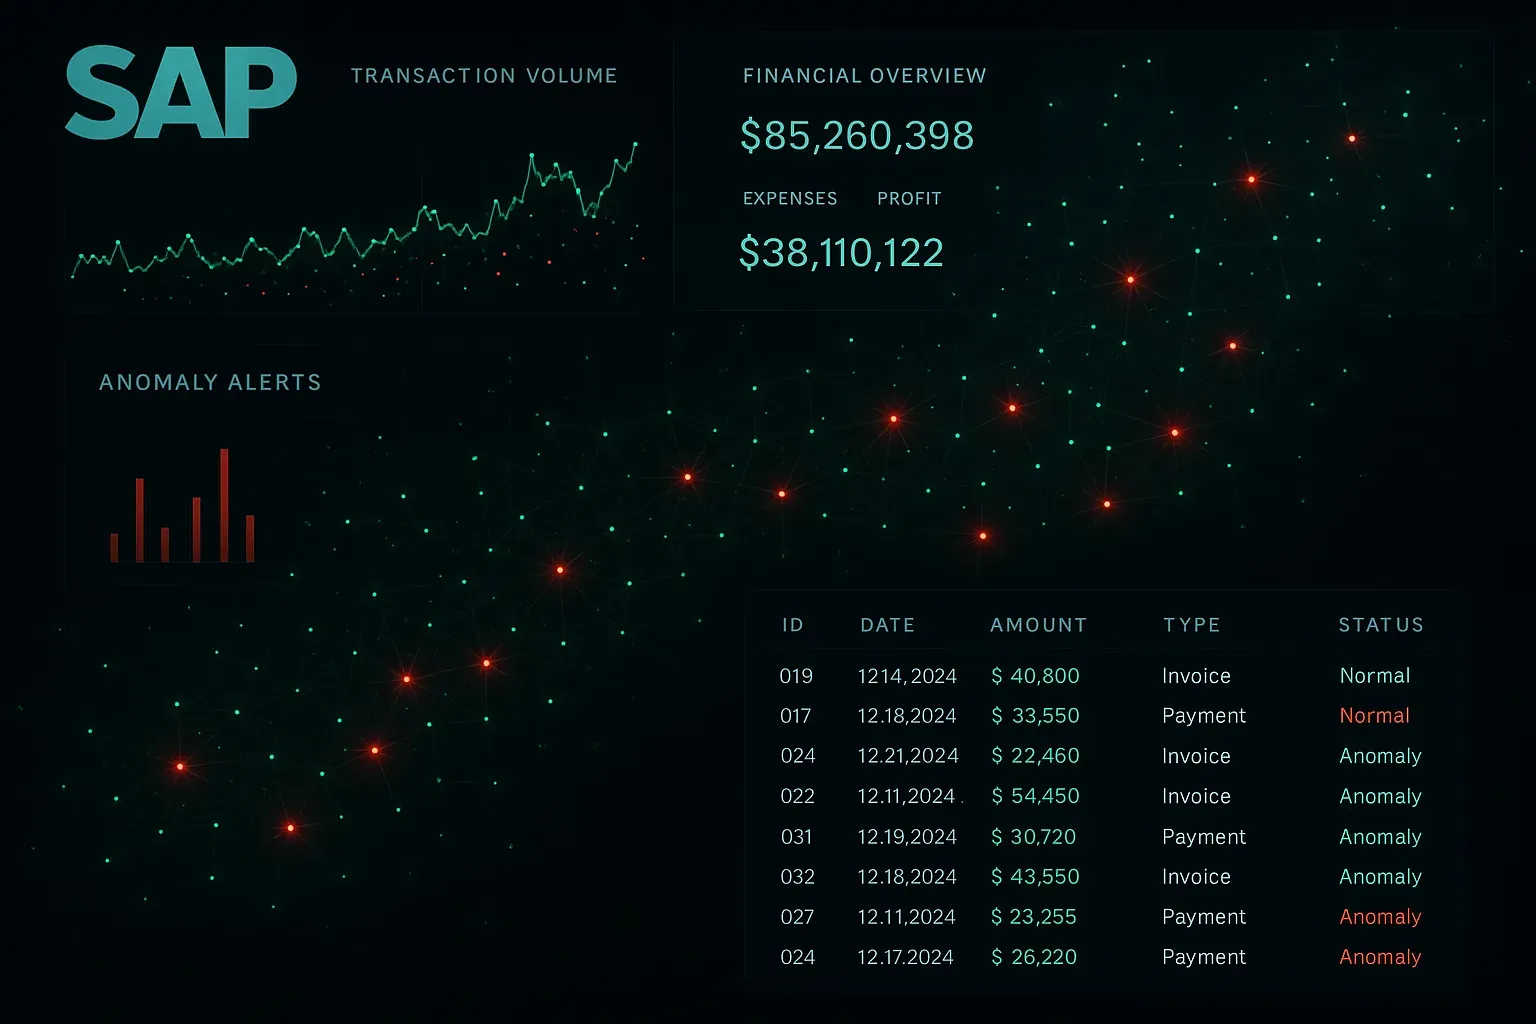
AI anomaly detection in SAP is one of those topics that sounds academic until you're sitting across from a CFO asking why a $2.3M duplicate payment slipped through three approval layers undetected. I've been in that room. Twice. That experience changed how I think about transactional data monitoring — and why rule-based validation alone will never be enough in a complex SAP landscape.
In this guide, I'll walk you through practical implementation patterns for AI-powered anomaly detection across SAP FI, MM, and SD transactional data. We'll cover algorithm selection, data extraction strategies, integration architecture, and real thresholds you can actually tune. No vendor pitch, no theory-only diagrams — just what works in production.
Why Rule-Based Monitoring Fails at Scale
Most SAP customers already have some form of transaction monitoring. You've got tolerance groups in FI, release strategies in MM, credit limits in SD. But these are rules — static thresholds someone defined years ago that haven't been revisited since the last consultant left the building.
The problem with rules isn't that they're wrong. It's that they're brittle. Business patterns change. Seasonal spikes occur. Vendor pricing shifts. And attackers — whether external or internal — learn your rules and work around them.
AI anomaly detection works differently. Instead of asking "does this transaction exceed a fixed limit?", it asks "does this transaction look statistically unusual compared to everything that came before it?" That's a fundamentally more powerful question.
Choosing the Right Algorithm for SAP Data
Not all anomaly detection algorithms are equal, and your choice depends heavily on the type of SAP data you're analyzing. Let me give you the breakdown I use with clients:
Isolation Forest — Your Go-To Starting Point
For most SAP FI and MM use cases, Isolation Forest is where I start. It handles high-dimensional tabular data well, works with both numerical and categorical features after encoding, and doesn't require labeled anomaly data to train (which you almost never have in clean form).
It works by randomly partitioning your feature space. Anomalous records — like a vendor invoice that's 10x the vendor's historical average, posted at 11:47pm on a Friday by a user who's never touched that vendor before — get isolated quickly. Normal records take many partitions to isolate.
import pandas as pd
from sklearn.ensemble import IsolationForest
from sklearn.preprocessing import LabelEncoder

# Assume df contains SAP BSEG + BKPF joined data
# Features: amount, posting_hour, vendor_id_encoded, user_id_encoded,
#           days_since_last_vendor_post, invoice_to_po_delta

features = [
    'WRBTR',           # Amount in document currency
    'posting_hour',    # Extracted from CPUDT + CPUTM
    'vendor_encoded',  # Label-encoded LIFNR
    'user_encoded',    # Label-encoded USNAM
    'days_gap',        # Days since last similar posting
    'amt_vs_avg_ratio' # Amount / vendor historical average
]

X = df[features].fillna(0)

model = IsolationForest(
    n_estimators=200,
    contamination=0.01,  # Expect ~1% anomalies — tune this
    random_state=42,
    n_jobs=-1
)

df['anomaly_score'] = model.fit_predict(X)
df['raw_score'] = model.score_samples(X)  # Lower = more anomalous

# Flag anomalies
anomalies = df[df['anomaly_score'] == -1].copy()
print(f"Flagged {len(anomalies)} transactions for review")
Autoencoder Networks — When You Have Volume
If you're processing millions of documents monthly, autoencoders become attractive. The model learns to compress and reconstruct normal transaction patterns. Records it can't reconstruct well — high reconstruction error — are anomalies.
The trade-off: you need sufficient volume to train meaningfully (typically 100K+ records minimum), and you need GPU infrastructure or at least a decent ML server. For mid-size SAP environments, Isolation Forest usually wins on the simplicity-to-value ratio.
Statistical Methods — Don't Overlook the Basics
Z-score and IQR-based outlier detection on vendor payment amounts, combined with Benford's Law analysis on the leading digits of invoice amounts, can catch a surprising number of fraud patterns. I've seen Benford's Law flag a procurement fraud scheme that had been running for 18 months because the fictitious invoices all clustered around values just under approval thresholds.
import numpy as np

def benfords_law_check(amounts: pd.Series) -> dict:
    """
    Check if invoice amount distribution follows Benford's Law.
    Significant deviation suggests potential manipulation.
    """
    # Expected Benford distribution for first digits 1-9
    benford_expected = {
        d: np.log10(1 + 1/d) for d in range(1, 10)
    }

    # Extract first significant digit
    first_digits = amounts.apply(
        lambda x: int(str(abs(x)).lstrip('0.')[0])
        if x != 0 else None
    ).dropna()

    observed = first_digits.value_counts(normalize=True).sort_index()

    deviations = {}
    for digit in range(1, 10):
        obs = observed.get(digit, 0)
        exp = benford_expected[digit]
        deviations[digit] = abs(obs - exp) / exp * 100

    return {
        'max_deviation_pct': max(deviations.values()),
        'suspicious_digits': [
            d for d, v in deviations.items() if v > 20
        ]
    }
Extracting the Right SAP Data
This is where most implementations fall apart. People grab raw transaction amounts and run anomaly detection on a single column. That's not anomaly detection — that's just flagging large numbers.
Effective feature engineering for SAP transactional data means combining fields across multiple tables. Here's the feature set that's consistently given me the best signal-to-noise ratio:
For FI (BKPF/BSEG) Anomaly Detection
- Amount features: WRBTR absolute value, ratio to vendor 90-day average, ratio to vendor historical max
- Temporal features: Hour of posting (CPUTM), day of week, days since last posting to same account, fiscal period position (start/end of period is suspicious)
- Behavioral features: Is this user's first posting to this vendor? How many postings has this user made today? What's the user's typical posting amount range?
- Structural features: Invoice-to-PO amount delta, number of line items, tax code consistency with vendor master
You'll extract most of this via CDS views or direct ABAP extraction. For SAP S/4HANA, CDS views with proper access control annotations give you a clean, performant extraction layer that respects authorization concepts.
ABAP Extraction Class
CLASS zcl_fi_anomaly_extractor DEFINITION
  PUBLIC FINAL CREATE PUBLIC.

  PUBLIC SECTION.
    TYPES: BEGIN OF ty_fi_feature,
             belnr      TYPE belnr_d,
             bukrs      TYPE bukrs,
             bldat      TYPE bldat,
             wrbtr      TYPE wrbtr,
             lifnr      TYPE lifnr,
             usnam      TYPE xubname,
             posting_hr TYPE i,
             posting_dow TYPE i,
             vendor_avg_90d TYPE wrbtr,
             amt_ratio      TYPE f,
             user_vendor_new TYPE abap_bool,
           END OF ty_fi_feature.

    TYPES tt_fi_features TYPE STANDARD TABLE OF ty_fi_feature
          WITH DEFAULT KEY.

    METHODS extract_features
      IMPORTING
        iv_date_from TYPE dats
        iv_date_to   TYPE dats
      RETURNING
        VALUE(rt_features) TYPE tt_fi_features.

  PRIVATE SECTION.
    METHODS get_vendor_avg
      IMPORTING iv_lifnr    TYPE lifnr
                iv_bukrs    TYPE bukrs
                iv_ref_date TYPE dats
      RETURNING VALUE(rv_avg) TYPE wrbtr.
ENDCLASS.

CLASS zcl_fi_anomaly_extractor IMPLEMENTATION.

  METHOD extract_features.
    " Join BKPF + BSEG for the date range
    SELECT bkpf~belnr, bkpf~bukrs, bkpf~bldat,
           bkpf~usnam, bkpf~cpudt, bkpf~cputm,
           bseg~wrbtr, bseg~lifnr
      FROM bkpf
      INNER JOIN bseg ON bkpf~belnr = bseg~belnr
                     AND bkpf~bukrs = bseg~bukrs
                     AND bkpf~gjahr = bseg~gjahr
      WHERE bkpf~bldat BETWEEN @iv_date_from AND @iv_date_to
        AND bseg~koart = 'K'  " Vendor line items only
        AND bseg~wrbtr > 0
      INTO TABLE @DATA(lt_raw).

    LOOP AT lt_raw INTO DATA(ls_raw).
      DATA(ls_feature) = VALUE ty_fi_feature(
        belnr  = ls_raw-belnr
        bukrs  = ls_raw-bukrs
        bldat  = ls_raw-bldat
        wrbtr  = ls_raw-wrbtr
        lifnr  = ls_raw-lifnr
        usnam  = ls_raw-usnam
        posting_hr  = ls_raw-cputm(2)  " Extract hour
        posting_dow = cl_abap_datfm=>get_day_of_week( ls_raw-bldat )
      ).

      " Vendor 90-day average
      ls_feature-vendor_avg_90d = get_vendor_avg(
        iv_lifnr    = ls_raw-lifnr
        iv_bukrs    = ls_raw-bukrs
        iv_ref_date = ls_raw-bldat
      ).

      IF ls_feature-vendor_avg_90d > 0.
        ls_feature-amt_ratio =
          ls_raw-wrbtr / ls_feature-vendor_avg_90d.
      ENDIF.

      APPEND ls_feature TO rt_features.
    ENDLOOP.
  ENDMETHOD.

  METHOD get_vendor_avg.
    DATA(lv_from) = iv_ref_date - 90.

    SELECT AVG( wrbtr ) FROM bseg
      WHERE lifnr = @iv_lifnr
        AND bukrs = @iv_bukrs
        AND koart = 'K'
      INTO @rv_avg.
  ENDMETHOD.

ENDCLASS.
If you're working with legacy code that needs cleanup before you can add reliable data extraction on top of it, the patterns in this refactoring guide will save you significant pain.
Integration Architecture: Where Does the AI Live?
You have three realistic options for where your anomaly detection model runs:
Option 1: Python Sidecar Service
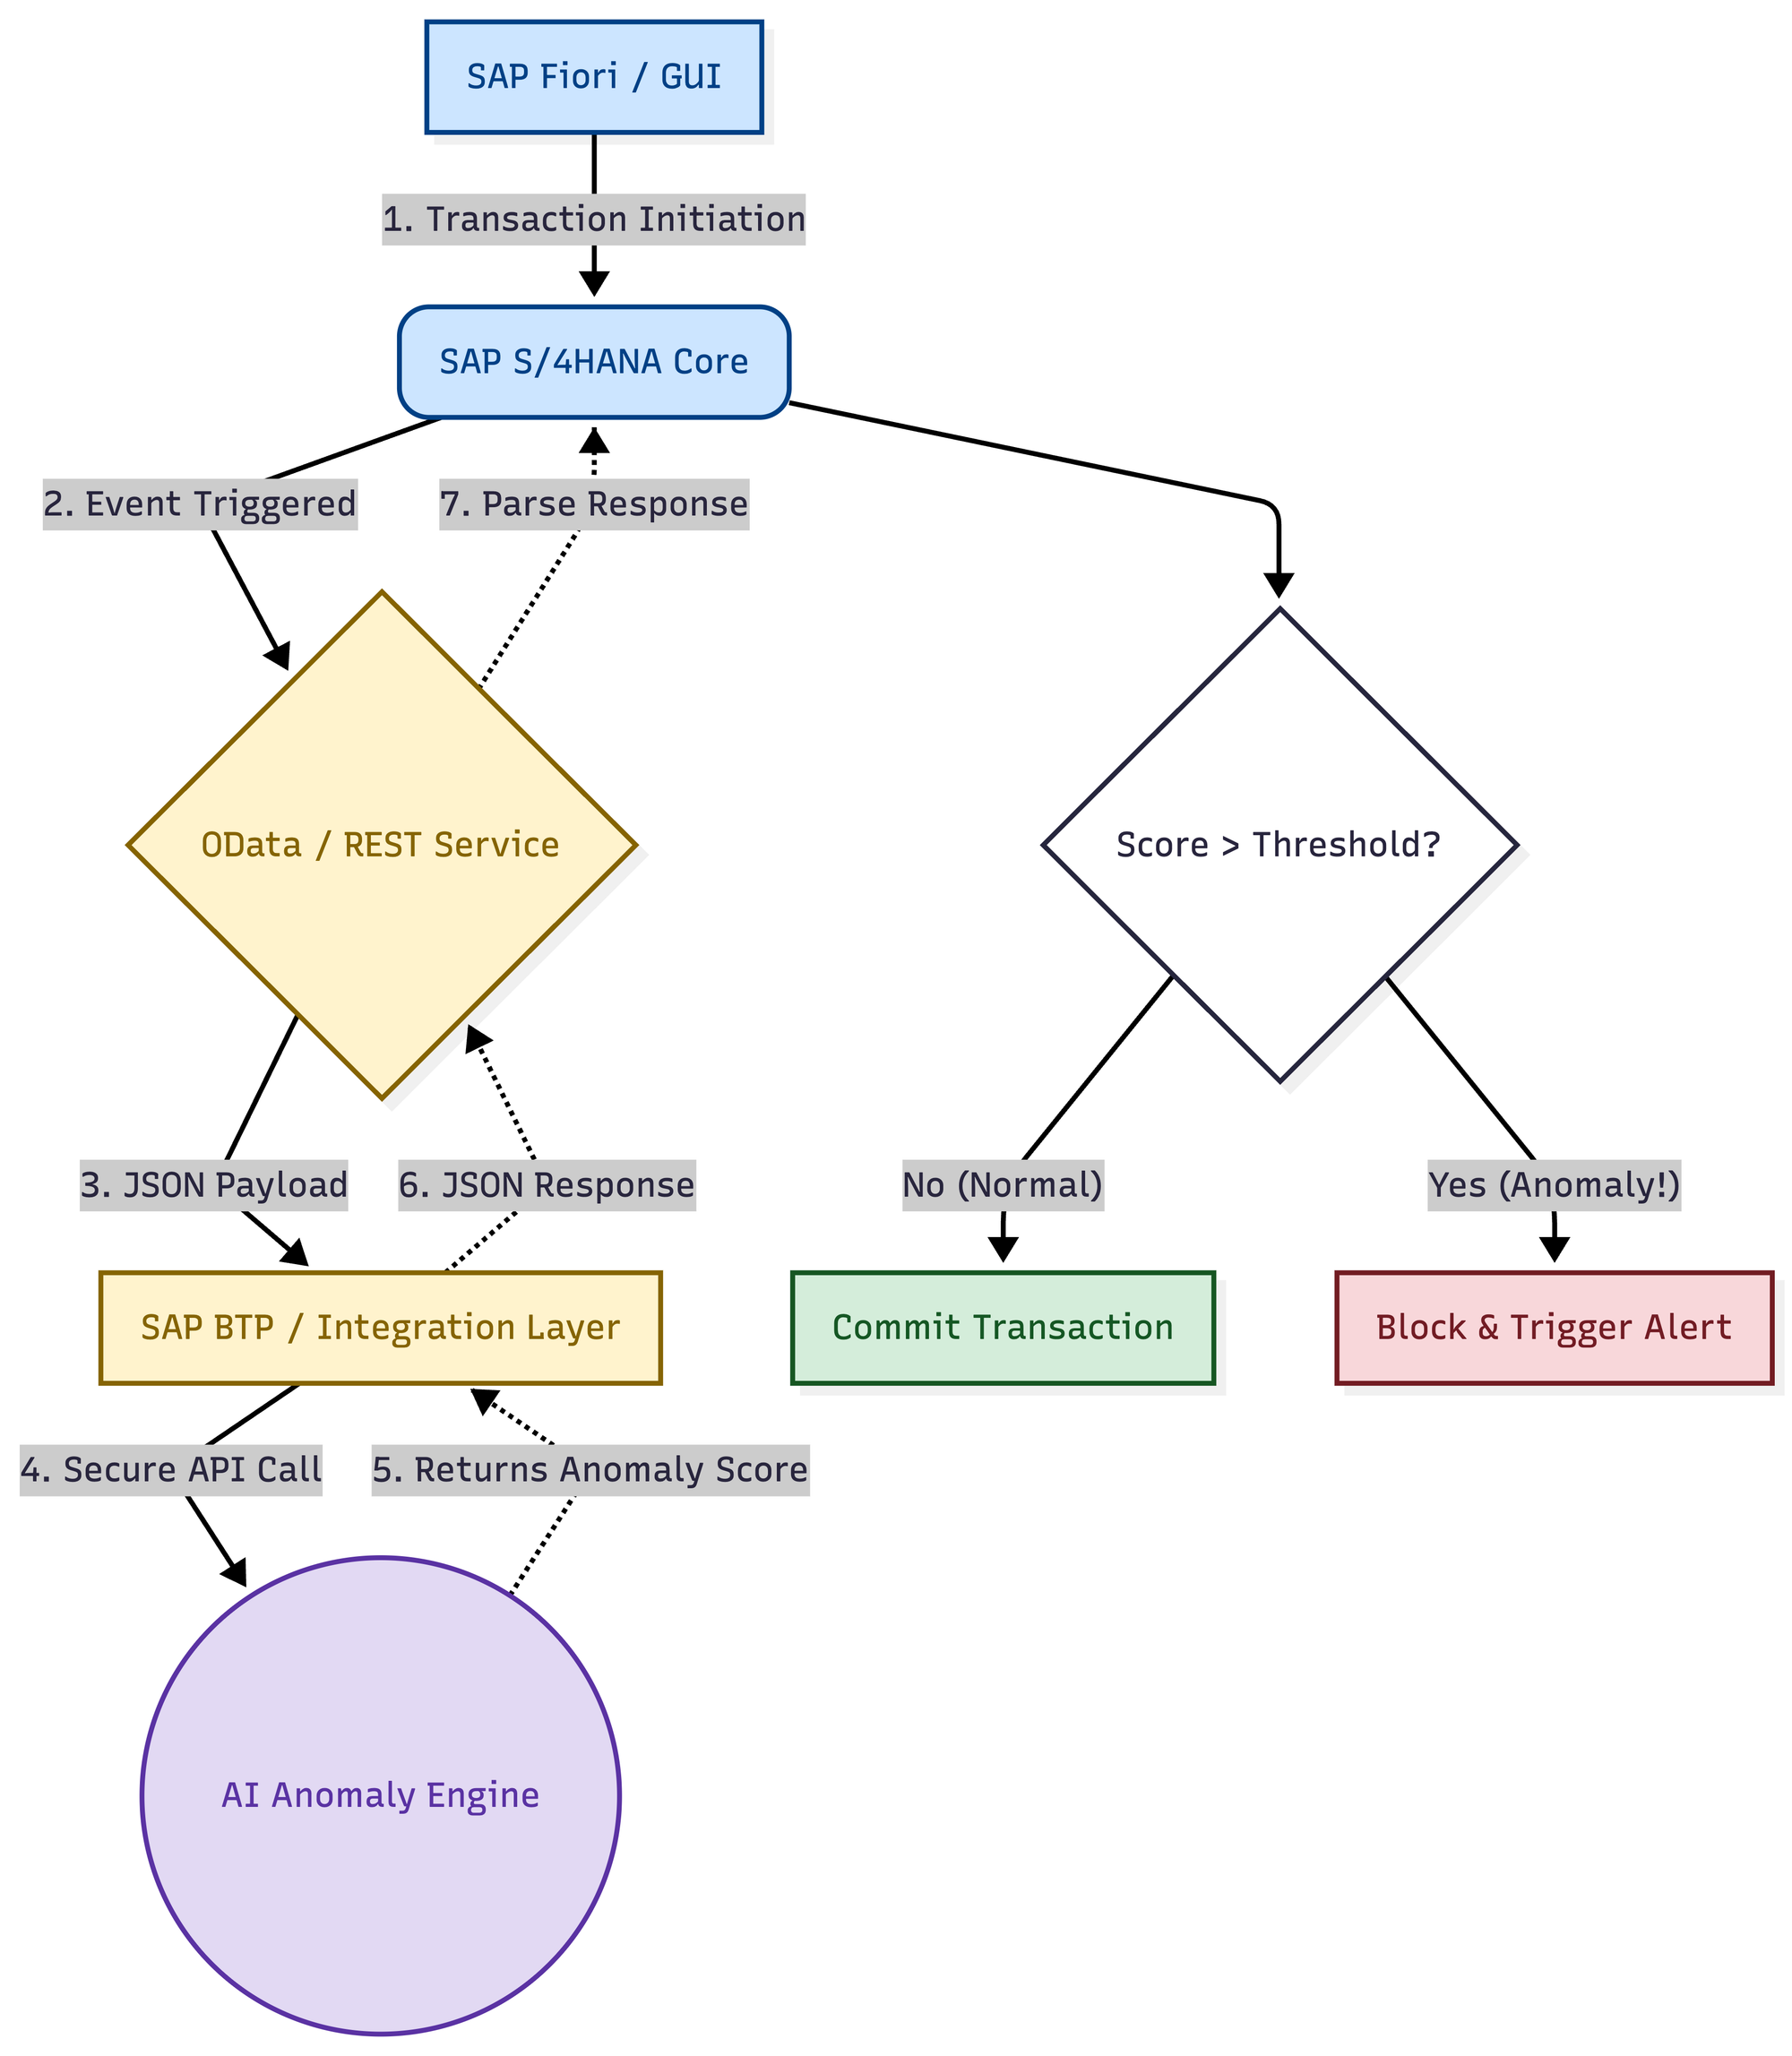
The model runs as a Python microservice (FastAPI works well). ABAP calls it via HTTP RFC or standard HTTP client after each posting batch. The service returns anomaly scores that get written to a custom Z-table for workflow triggering.
This is my recommended approach for most implementations. The ML stack stays in Python where it belongs, and SAP integration is clean via direct HTTP client patterns from ABAP without requiring middleware infrastructure.
Option 2: Batch Processing with File Exchange
Extract daily/hourly batches from SAP via ABAP, push to a shared file location or message queue, Python service processes and writes results back. Simpler to implement, but latency means you're detecting anomalies hours after the fact. Acceptable for audit-trail use cases, problematic for real-time fraud prevention.
Option 3: Embedded SAP Analytics Cloud or HANA ML
SAP HANA has native PAL (Predictive Analytics Library) functions including isolation forest. If you're on S/4HANA and your team is comfortable with HANA SQL Script, this eliminates the external service dependency. The trade-off is that model iteration is slower and the ML tooling is less mature than scikit-learn/PyTorch ecosystems.
Scoring, Thresholds, and Alert Workflow
Getting the model running is the easy part. The hard part is operationalizing it without burying your AP team in false positives.
Start with a risk scoring tier rather than binary anomaly/normal classification:
- Score < -0.15 (raw Isolation Forest): Log only, no human action
- Score -0.15 to -0.30: Flag for next-day review queue
- Score > -0.30: Immediate alert, potentially hold payment
These thresholds assume a contamination rate of ~1%. You'll need to calibrate based on your actual false positive tolerance. I typically run the model in shadow mode for 30 days — scoring everything but not alerting — to understand the score distribution before going live.
For the alert workflow itself, a custom ABAP workflow or SAP Business Workflow task triggered from your Z-table is usually sufficient. The key fields to surface to reviewers: the anomaly score, which features drove it (feature importance from the model), and direct links to the SAP document. Don't make reviewers hunt.
Handling Model Drift
Business patterns change. A model trained on pre-pandemic data will flag every post-pandemic transaction as anomalous if you let it stagnate. You need a retraining cadence.
My standard recommendation: retrain monthly on a rolling 12-month window, with a weekly check on the distribution of anomaly scores. If your daily anomaly rate suddenly jumps from 0.8% to 3%, you've got drift — or a genuine fraud wave. Either way, you need to know.
Build version tracking into your model store. When a new model goes live, keep the previous version scoring in parallel for two weeks. If the new model's false positive rate (confirmed by reviewer feedback) is higher, roll back.
What to Expect in the First 90 Days
Be honest with your stakeholders about the learning curve. In weeks one through four, you will have false positives. Some will be embarrassing — flagging a senior VP's routine expense reimbursement. This is normal. Use reviewer feedback to improve features, not to question the approach.
By month two, if your feature engineering is solid, you should see the false positive rate drop below 15% and start catching genuinely suspicious patterns — duplicate vendor setups, round-number invoices from new vendors, postings clustered around period-end from specific users.
By month three, you'll have enough labeled data (anomalies confirmed or dismissed by reviewers) to consider upgrading from unsupervised to semi-supervised detection, which dramatically improves precision.
The event-driven architecture patterns discussed in this integration deep-dive can help you build a more responsive alerting pipeline once you're ready to move beyond batch processing. And if your team is dealing with performance bottlenecks in the ABAP extraction layer, optimizing those queries should be a prerequisite before you add ML processing on top.
Wrapping Up
AI anomaly detection in SAP isn't a plug-and-play product. It's an engineering effort that requires thoughtful feature design, honest stakeholder management, and a commitment to ongoing calibration. But done right, it catches what rule-based systems miss — and it keeps getting better the longer it runs.
Start with FI vendor payables, use Isolation Forest, run in shadow mode before alerting, and build a feedback loop with your reviewers from day one. That combination has caught real fraud in every deployment I've been part of.
This article is part of the SAP AI integration & architecture hub — patterns, use cases, and guardrails for AI in SAP systems.