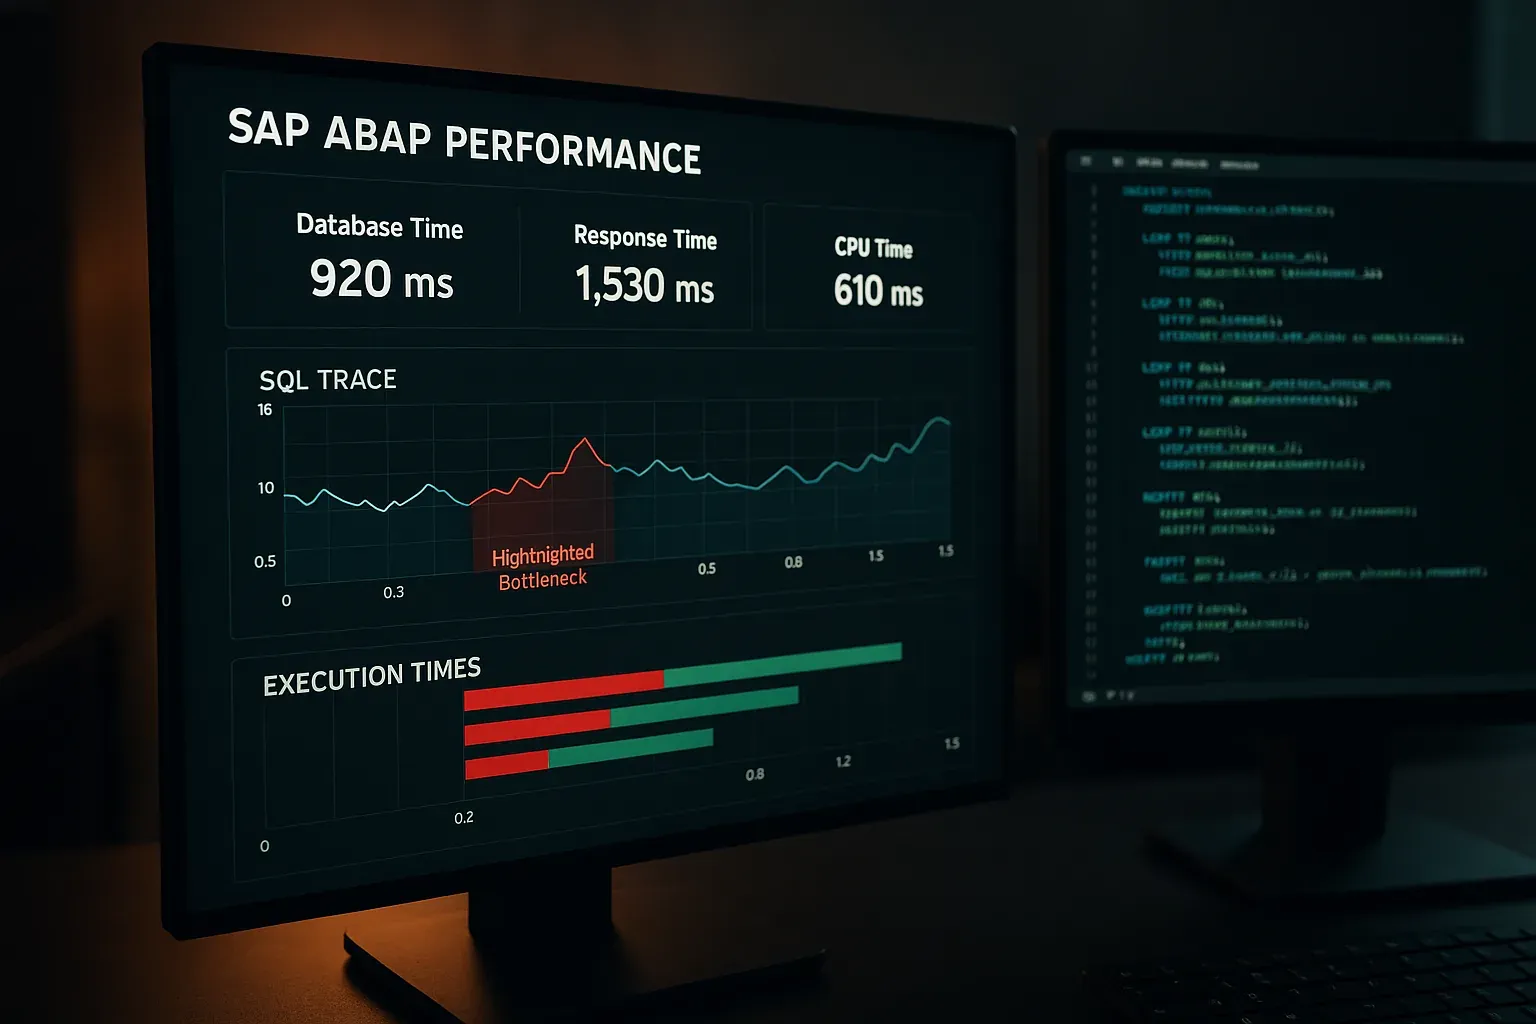
Every senior ABAP developer has been there: a program that runs fine in development suddenly crawls in production, users are complaining, and your phone won't stop ringing. The difference between panic and confidence in that moment is knowing which tools to reach for. Today we're going deep on ABAP performance tuning with ST05, SAT, and SQLM — the three tools that will tell you exactly where your bottleneck is hiding.
This isn't a surface-level overview. We're going to work through real scenarios, show you what each tool actually tells you, and explain how to act on that information. By the end, you'll have a structured approach to diagnosing any ABAP performance problem.
Understanding the Bottleneck Triangle
Before you open a single transaction, get this mental model straight: almost every ABAP performance problem falls into one of three categories.
- Database layer — too many roundtrips, missing indexes, full table scans, inefficient SQL
- ABAP layer — nested loops, inefficient internal table operations, unnecessary processing
- Network/transfer layer — transferring more data than you need, too many RFC calls
Each of these maps to a different tool. ST05 owns the database layer. SAT covers the ABAP layer. SQLM gives you the long-running production view. Learn which symptom points to which tool and you'll cut your diagnosis time in half.
ST05: The SQL Trace Deep Dive
ST05 (SQL Trace) is the workhorse. It records every database operation your program makes — every SELECT, INSERT, UPDATE, DELETE — along with execution time, row counts, and the actual WHERE clause that was sent to the database.
Starting a Trace Correctly
The most common mistake I see is tracing too broadly. Open ST05, select SQL Trace, and use the filter options to restrict to your user ID. Then activate the trace, run your transaction (just the slow part, not the whole thing), and deactivate immediately. The smaller your trace window, the less noise you wade through.
After deactivating, click Display Trace. You'll see a list of database statements sorted by time. Sort by Duration descending — your problem is almost always in the top five rows.
What to Look for in ST05 Results
Here's what the columns actually mean in practice:
- Duration — wall-clock time in microseconds. Anything over 100ms for a single statement deserves attention.
- Records — rows returned. A statement returning 50,000 rows when you need 10 is a red flag.
- Object — the table or view being accessed. Cross-check this with SE11 to see what indexes exist.
Double-click any statement to see the full SQL. This is gold. You'll see the exact WHERE clause OpenSQL generated, which tells you whether your index is being used.
Classic ST05 Finding: The Missing Index
" Bad code - selecting on a non-indexed field
SELECT *
  FROM vbap
  INTO TABLE @DATA(lt_items)
  WHERE erdat = @lv_date.  "ERDAT is not in standard index

" Better - if you must use this field, request an index
" or restructure using a different entry point
SELECT vbeln, posnr, matnr, kwmeng
  FROM vbap
  INTO TABLE @DATA(lt_items)
  WHERE vbeln IN (SELECT vbeln FROM vbak WHERE audat = @lv_date)
    AND matnr IN @lt_materials.
When ST05 shows a full table scan (you'll see this in the execution plan if you click Display Explain), you have two options: add an index via SE11, or restructure your query to use an existing one. On HANA systems, the optimizer is smarter, but the principle still stands — help the optimizer, don't fight it.
Spotting the N+1 Pattern in ST05
One of the most destructive patterns in ABAP is the SELECT inside a loop. ST05 makes this painfully obvious: you'll see the same table hit hundreds or thousands of times with slightly different WHERE clauses.
" Anti-pattern: SELECT inside LOOP
LOOP AT lt_orders INTO DATA(ls_order).
  SELECT SINGLE *
    FROM likp
    INTO @DATA(ls_delivery)
    WHERE vbeln = @ls_order-vbeln_del.
  " ... process
ENDLOOP.

" Fix: collect keys, then one SELECT
SELECT vbeln, bldat, wadat_ist
  FROM likp
  INTO TABLE @DATA(lt_deliveries)
  FOR ALL ENTRIES IN @lt_orders
  WHERE vbeln = @lt_orders-vbeln_del.
In ST05, this shows up as 300 identical SELECT SINGLE statements where you expected one. When you see this pattern, the fix is always the same: collect your keys first, then use FOR ALL ENTRIES or a JOIN. For a deeper look at that tradeoff, see our article on CDS view performance anti-patterns and HANA queries.
SAT: Runtime Analysis for the ABAP Layer
ST05 tells you about database time. But what if the database is fast and the program is still slow? That's where SAT (ABAP Trace, formerly SE30) comes in. SAT measures time spent in ABAP processing itself — which methods are called, how often, and how long each takes.
Running SAT Effectively
Open SAT, enter your program name or transaction, and set the measurement type. For most cases, Aggregated is what you want — it shows you totals per call rather than every single invocation. For loop analysis, Statement level gives more granularity.
Run your program through SAT, then analyze the results. The hit list view shows you time distribution across program units. A method that's called 50,000 times with 2ms each is a bigger problem than one that runs once for 100ms.
Reading the SAT Hit List
Focus on two columns: Gross time (total time including called routines) and Net time (time in that unit alone). If gross and net are similar, the work is happening right there. If gross is much higher than net, the expensive part is in something this routine calls — drill down.
Common SAT Finding: Inefficient Internal Table Operations
" Slow: linear search on unsorted table
LOOP AT lt_large_table INTO DATA(ls_row).
  READ TABLE lt_lookup INTO DATA(ls_lookup)
    WITH KEY field1 = ls_row-field1.  "Linear search - O(n)
ENDLOOP.

" Fast: sorted table or HASHED table with key access
DATA: lt_lookup TYPE HASHED TABLE OF ty_lookup
               WITH UNIQUE KEY field1.

" Populate once
SELECT field1, field2
  FROM ztable
  INTO TABLE @lt_lookup.

" Now each READ is O(1)
LOOP AT lt_large_table INTO DATA(ls_row).
  READ TABLE lt_lookup INTO DATA(ls_lookup)
    WITH TABLE KEY field1 = ls_row-field1.
ENDLOOP.
SAT will show you the READ TABLE statement consuming a disproportionate share of ABAP runtime. Switching from a standard table to a hashed table for lookup scenarios is one of the highest ROI changes you can make. For more on writing clean, efficient ABAP structures, the principles in SOLID principles with ABAP practical examples apply directly to how you structure your data handling.
SAT and String Operations
String concatenation in loops is another SAT classic. If you're building strings in a LOOP with CONCATENATE or &&, SAT will show that subroutine eating CPU. Use STRING_BUFFER patterns or collect into a table and join at the end.
SQLM: Production SQL Monitoring
ST05 requires you to be present when the problem happens. Production performance issues often occur at 2am during batch jobs you can't manually trace. SQLM (SQL Monitor) solves this by continuously collecting statistics on all SQL statements executed in the system.
What SQLM Captures
SQLM runs passively in the background (activate it via transaction SQLM or through the DBA Cockpit). It records:
- Total execution count per statement
- Total and average execution time
- Maximum execution time (catches intermittent spikes)
- Total records transferred
- The program and include where the statement lives
This last point is critical. SQLM gives you the exact code location, so you're not hunting through a large codebase trying to find where a particular SELECT is being called.
Analyzing SQLM Data
Open SQLM and go to Display Monitor. Sort by Total Time first — this shows you cumulative impact. A statement that runs fast but 100,000 times per day may be more important to fix than one slow statement that runs once.
Then sort by Max Time. This surfaces outliers — statements that occasionally spike. These are usually locking issues or cases where the optimizer chose a bad plan under specific data conditions.
Cross-referencing SQLM with ST05
Once SQLM shows you the suspicious statement, you can take the program name, reproduce the scenario, and trace it with ST05 to see the full execution plan. SQLM narrows the field; ST05 closes the case. This combination is your standard investigation playbook for production incidents.
A Real Investigation Workflow
Let me walk you through how I actually approach a performance complaint. This workflow has saved me hours of guesswork.
Step 1 — Characterize the problem. Is it consistently slow, or intermittently slow? Consistent usually means code. Intermittent usually means locking, data volume growth, or statistics.
Step 2 — Check SQLM first. If the problem happens in production, SQLM already has data. Look for the program involved and see what SQL it's running and at what cost.
Step 3 — Run ST05 in a test environment. Reproduce the slow scenario with representative data volume. The execution plan matters, and you need to see it against realistic data.
Step 4 — If database time looks reasonable, switch to SAT. If ST05 shows the total database time is, say, 2 seconds but the program takes 30, you have 28 seconds of ABAP processing to find. SAT will find it.
Step 5 — Fix and verify. Never eyeball a fix. After changing the code, run ST05 or SAT again and compare the numbers. Confirmation is not optional.
Connecting Performance Tools to Code Quality
Performance problems rarely exist in isolation. Tight coupling between classes makes it hard to optimize individual components. If you've been building testable, modular ABAP as described in our testable ABAP architecture guide, you'll find it much easier to isolate and fix performance bottlenecks without breaking everything else.
Similarly, when you're working with legacy reports that have grown organically over years, performance issues are often embedded in structural problems. The approach we cover in refactoring legacy ABAP reports to clean OOP naturally surfaces opportunities for optimization as you restructure.
And if you're working with CDS views, the performance considerations overlap significantly — check out the dedicated coverage in CDS view performance anti-patterns for the view-layer equivalent of what we've covered here.
Quick Reference: Which Tool for Which Problem
| Symptom | Start with | Then use |
|---|---|---|
| Slow during batch in production | SQLM | ST05 |
| Interactive transaction is slow | ST05 | SAT if DB time is low |
| CPU high, DB time low | SAT | — |
| Intermittent spikes | SQLM (Max Time) | SM66 for lock analysis |
| Too many DB roundtrips | ST05 (count hits) | Restructure with FOR ALL ENTRIES |
Final Thoughts
Performance tuning in ABAP is a skill that compounds over time. The first time you use ST05, you'll find something surprising. The tenth time, you'll spot the pattern in under five minutes. The key is building the habit of measuring before optimizing — gut instinct about what's slow is wrong surprisingly often.
Start with SQLM for production visibility. Use ST05 for hands-on database investigation. Bring in SAT when the problem is clearly in ABAP processing rather than the database. And always measure twice: once to find the problem, once to confirm your fix actually worked.
These three tools, used together with discipline, will handle 90% of the performance issues you'll encounter in real SAP systems.